Cultural Analytics
by Anastasiya Tronina (translated into English by Rebekka Eick)
Definition
Cultural analytics is defined as a quantitative analysis of large visual data sets from the cultural and humanities context using computer-based techniques of visualization. The focus of this area is on the following questions: What does it mean to represent culture in data? Which possibilities does the computer-assisted analysis of large cultural data offer in contrast to qualitative methods in the humanities and social sciences? [1]
Prominent representatives
The concept was developed by media theorist and artist Lev Manovich in 2005. In 2007 he founded the Software Studies Initiative Laboratory (University of California, San Diego), where this cultural paradigm is still being worked on to date. [2] Their work includes practical projects such as “Visual Earth”, “Phototrails” and “Selfiecity”.
Explanation of content and classification
Studies and projects by Cultural Analytics deal with digitized historical artifacts (such as works of the fine art, films and magazines) and modern works by semi- / professionals (works of contemporary art, comics, photos), as well as digital media content and the online user interaction with this content (publications on social networks). As Lev Manovich says: “Cultural Analytics are interested in everything created by everybody.” [3]
Cultural Analytics use various interactive techniques of visualization. This creates dynamic maps of global cultural developments that reflect activities, aspirations and cultural preferences. [4]
An example of such a technique is ImagePlot. With this visualization technique, data points are arranged in a two-dimensional Cartesian data system. With ImagePlot, larger numbers of digital images can be sorted according to similarity criteria (brightness, shade, color saturation, shape). The peculiarity of the technology is that not only abstract data points can be represented in the diagram, but images themselves. [5]
This technique was used in the project Mondrian vs Rothko (2011). The visualization shows 128 paintings by Piet Mondrian (1905-1917) and 123 paintings by Mark Rothko (1938-1953). This project shows that visualization techniques are not only used to search for similarities, but also for differences. It can be seen, for example, how Mark Rothko explored the areas of brightness / color space that Mondrian did not reach (highly saturated and bright images in the upper right corner anddark images in the left part). [6]
Alternative Terms
In addition to “Cultural Analytics”, two more terms have gained acceptance: “Digital Humanities” and “Social Computing”. According to Manovich, these areas differ as follows: Computer-based algorithms and methods for analyzing historical artifacts from the areas of literature, art, music, etc., which were created before the beginning of the 20th century, are used in the field of studies of “Digital Humanities”. The material for the studies of “Social Computing” is much larger. In “Social Computing”, data created in social networks and user interaction have been examined since 2004. [7]
Criticism
What is criticized about the concept of Cultural Analytics first of all are the statistical results, which do not include analysis, interpretations and conclusions. This can be seen in the “Selfiecity” project, in which selfies of instagram users are only categorized according to categories such as gender, age and facial expression. Second, the visualization techniques are accused of the fact that the design of the information can replace their interpretation. Some projects work more like media art projects and less like sociological studies. [8]
[1] Manovich, Lev: Cultural Analytics, Social Computing and Digital Humanities. In: Schäfer, Mirko Tobias; Karin van Es (Ed.): The Datafied Society. Studying Culture through Data, Amsterdam (2017), p. 55.
[2] Cultural Analytics Lab. At: http://lab.culturalanalytics.info/p/about.html [Accessed: 06.03.2019].
[3] Manovich, Lev (2017), p. 61.
[4] Manovich, Lev (2009): How to Follow Global Digital Cultures, or Cultural Analytics for Beginners. At: http://manovich.net/index.php/projects/how-to-follow-global-digital-cultures [Accessed: 28.02.2019], p. 10.
[5] Cf. Peter, Sven; Wübbena, Thorsten: Datenvisualisierung in den Geisteswissenschaften. Ein Laborbericht als Tagungsprolog (2016).In: archiv.ub.uni-heidelberg.de. At: http://archiv.ub.uni-heidelberg.de/artdok/volltexte/2016/4348 [Accessed: 28.02.2019], p. 12.
[6] Cf. Cultural Analytics Lab. At: http://lab.culturalanalytics.info/2016/04/mondrian-vs-rothko.html [Accessed: 17.03.2019].
[7] Cf. Manovich, Lev (2017), p. 55-56.
[8] Cf. Caplan, Lindsay (2016): Method without Methodology: Data and the Digital Humanities. At: https://www.e-flux.com/journal/72/60492/method-without-methodology-data-and-the-digital-humanities/ [Accessed: 05.03.2019], p. 6.
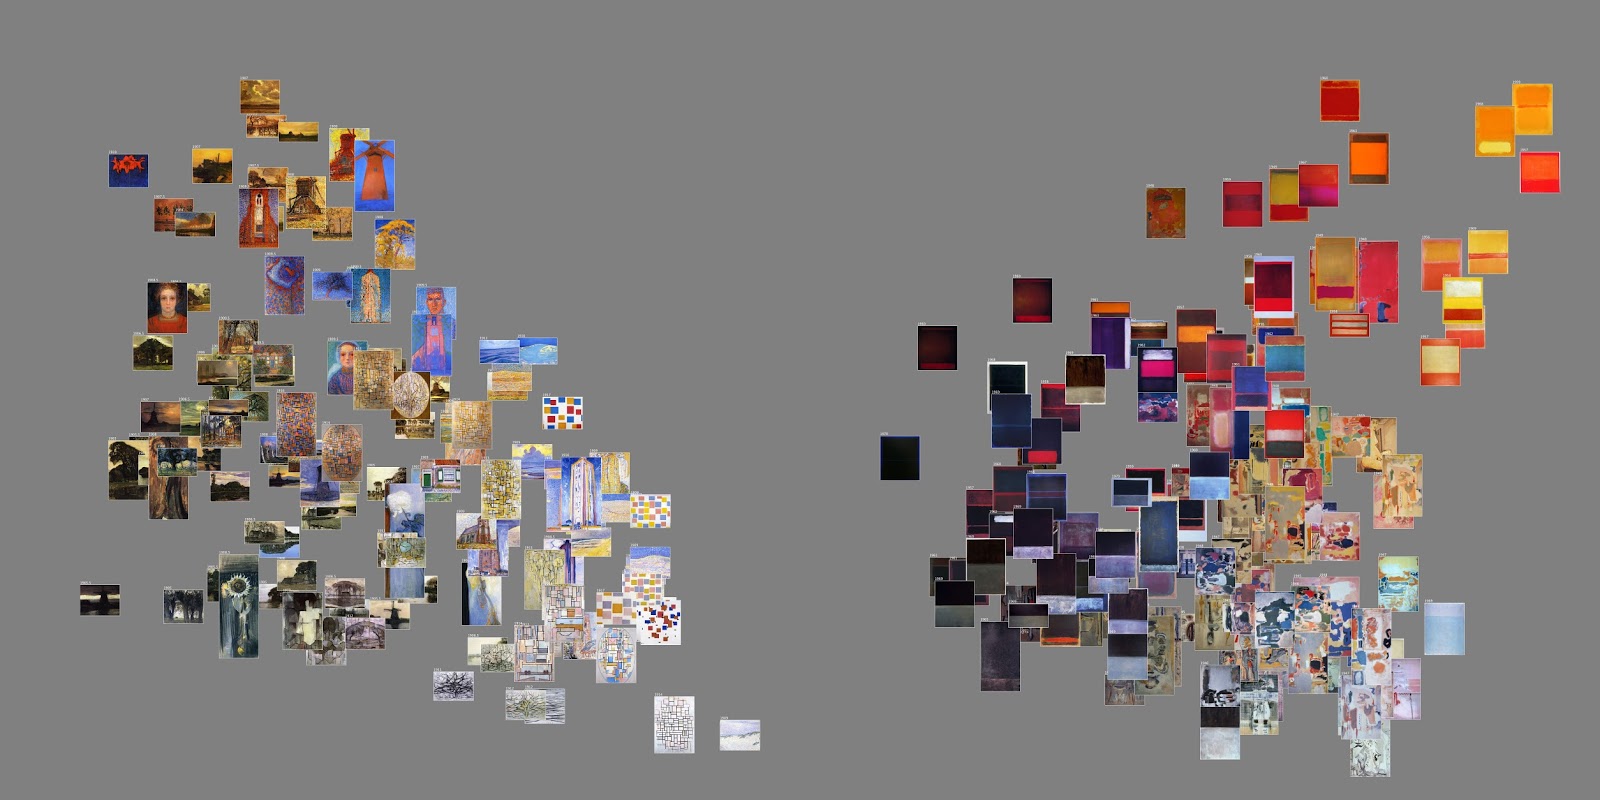
Image description by Lev Manovich: Data: 128 paintings by Piet Mondrian (1905 - 1917) and 151 paintings by Mark Rothko (1944 - 1957). Mapping: X-axis: brightness mean, Y-axis: saturation mean. This visualization demonstrates how image plots can be used to compare multiple data sets. In this case, the goal is to compare similar number of paintings by Piet Mondrian and Mark Rothko (produced over comparable time periods of 13 years) along particular visual dimensions.
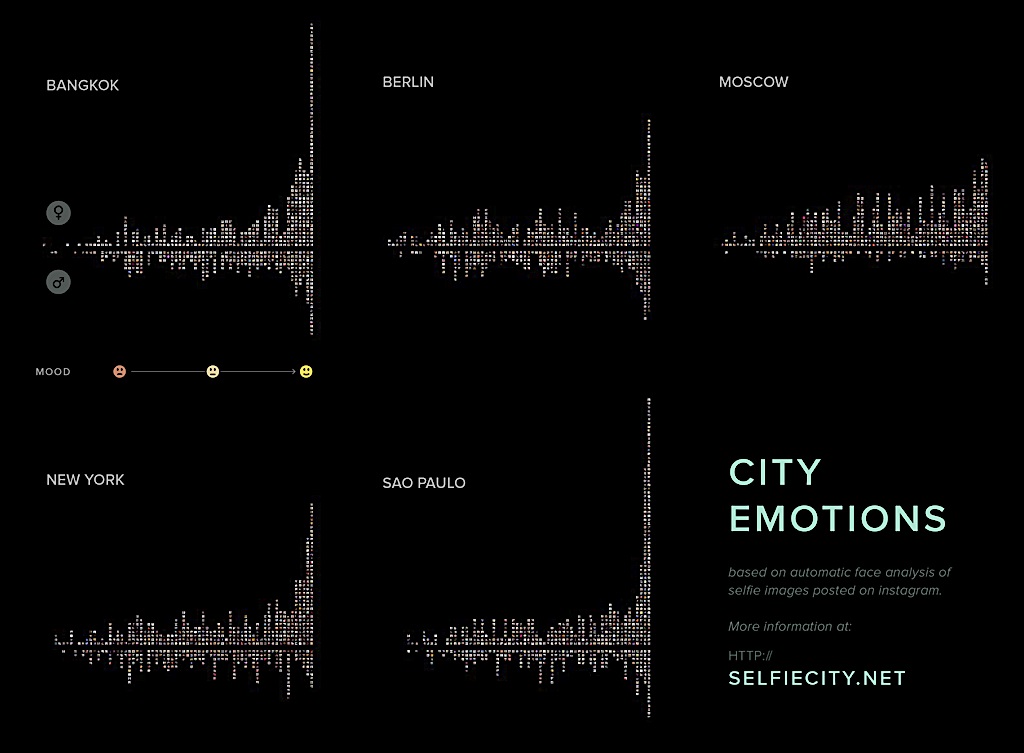
Image despription by Lev Manovich: One of the imageplots presenting the findings of our research. Learn more on the project website http://selfiecity.net/.